
Building Signal: The Process Behind the Projections
Signal, Alpaca’s new polling and sentiment mapping tool, was officially launched on 29 April 2026. The site visually presented election projections for each council area, ward, and devolved parliament constituency involved in the May 2026 elections. It also included sentiment maps showing regional views on questions concerning renewable energy, data centres, and trust in developers.
By the time the beta site was launched, I’d been working on Signal for around two months. The project grew out of watching the innovative work my colleague Henry Whitelaw was doing in building Herd. I was vaguely aware of ‘vibe coding’, using large language models to help build software without the need to manually write every line of code, but it was only through seeing the work Henry was doing with Codex that I became acutely aware of how these technologies are reshaping the boundaries of what is possible. So, during a brief conversation about what Alpaca might do ahead of the local elections, I suggested that some kind of election projection tool might be possible.
While I don’t have a background in coding, I do have a long-standing interest in polling and election forecasts. I used to love Nate Silver’s FiveThirtyEight website and podcast, which focused on predicting elections in the US, and I had a rough understanding of how his electoral models worked. So, whenever I had a spare hour in my working day, I began sketching out how a simplified version of that kind of model could be adapted to predict the local elections.
I won’t go into reams of detail about how the model works, or how it evolved into its final iteration (there is a Methodology page on the Signal website if you’re interested). However, a brief overview is worthwhile. The first step was to build an aggregate poll. Individual polls of the next UK general election were weighted by recency, sample size, and pollster accuracy (which I defined based on the accuracy of pollsters’ previous election predictions), and then combined to form a National Polling Average. When I came to predicting the Scottish and Welsh elections, I built an equivalent polling average.
In each ward or constituency, these polling averages were used to drive a uniform swing for each party against a previous electoral baseline (in most cases, this was simply the party’s vote share the last time the seat was contested). Adjustments were then made to each party based on the given ward’s specific demographic and geographic profile. These adjustments were primarily derived from aggregated demographic breakdowns of polling data. For instance, polls might show that Reform UK’s support is 26% in the population as a whole, but only 10% amongst 18-25 year olds. If a ward had a higher-than-average proportion of this age demographic, it makes sense to take this into account and adjust the party’s level of support down. The elements the model adjusted for chose to adjust for, chosen mostly due to their occurrence in both census data and polling breakdowns, were:
Age profile
NS-SEC (socio-economic classification)
Education levels
Rural / Urban classification
Housing tenure
Region
2016 Brexit referendum result
Once I had built an initial model, combining the polling average, demographic adjustments and some additional party-specific adaptations (for instance, to counter Reform UK’s lack of an electoral baseline in many wards), I tested it against the 2025 local elections. After some further tweaks to the model and help from Henry and Peter on visual presentation, Signal was launched.
So, how did it perform?
Signal’s final projections for the English local elections had Labour winning 1154 seats, closely followed by Reform UK with 1138 councillors, the Conservatives with 1010, the Liberal Democrats on 889, and the Greens on 575.
In one, rather obvious way, these projections were wrong. Reform UK won the most seats by a large margin, picking up 1454 seats to Labour’s 1068. However, when you dig a bit deeper, the results look considerably stronger. Signal predicted the correct council control in 107 of the 136 Councils, 79% of the time. It also correctly called the largest party in 101 of the elections.
Dr Mark Pack, a Liberal Democrat Peer and polling expert, has ranked the accuracy of various local election seat projections released by pollsters, data journalists and others through their root mean square error, a common way of measuring a statistical model’s predictions compared to the actual values. By this measure, Signal performs creditably, ranking 6th out of 12 projections (you can see the numbers in the photos below). Equivalent rankings for the Senedd and Scottish parliamentary elections have Signal coming in as the 3rd and 4th most accurate prediction, respectively.
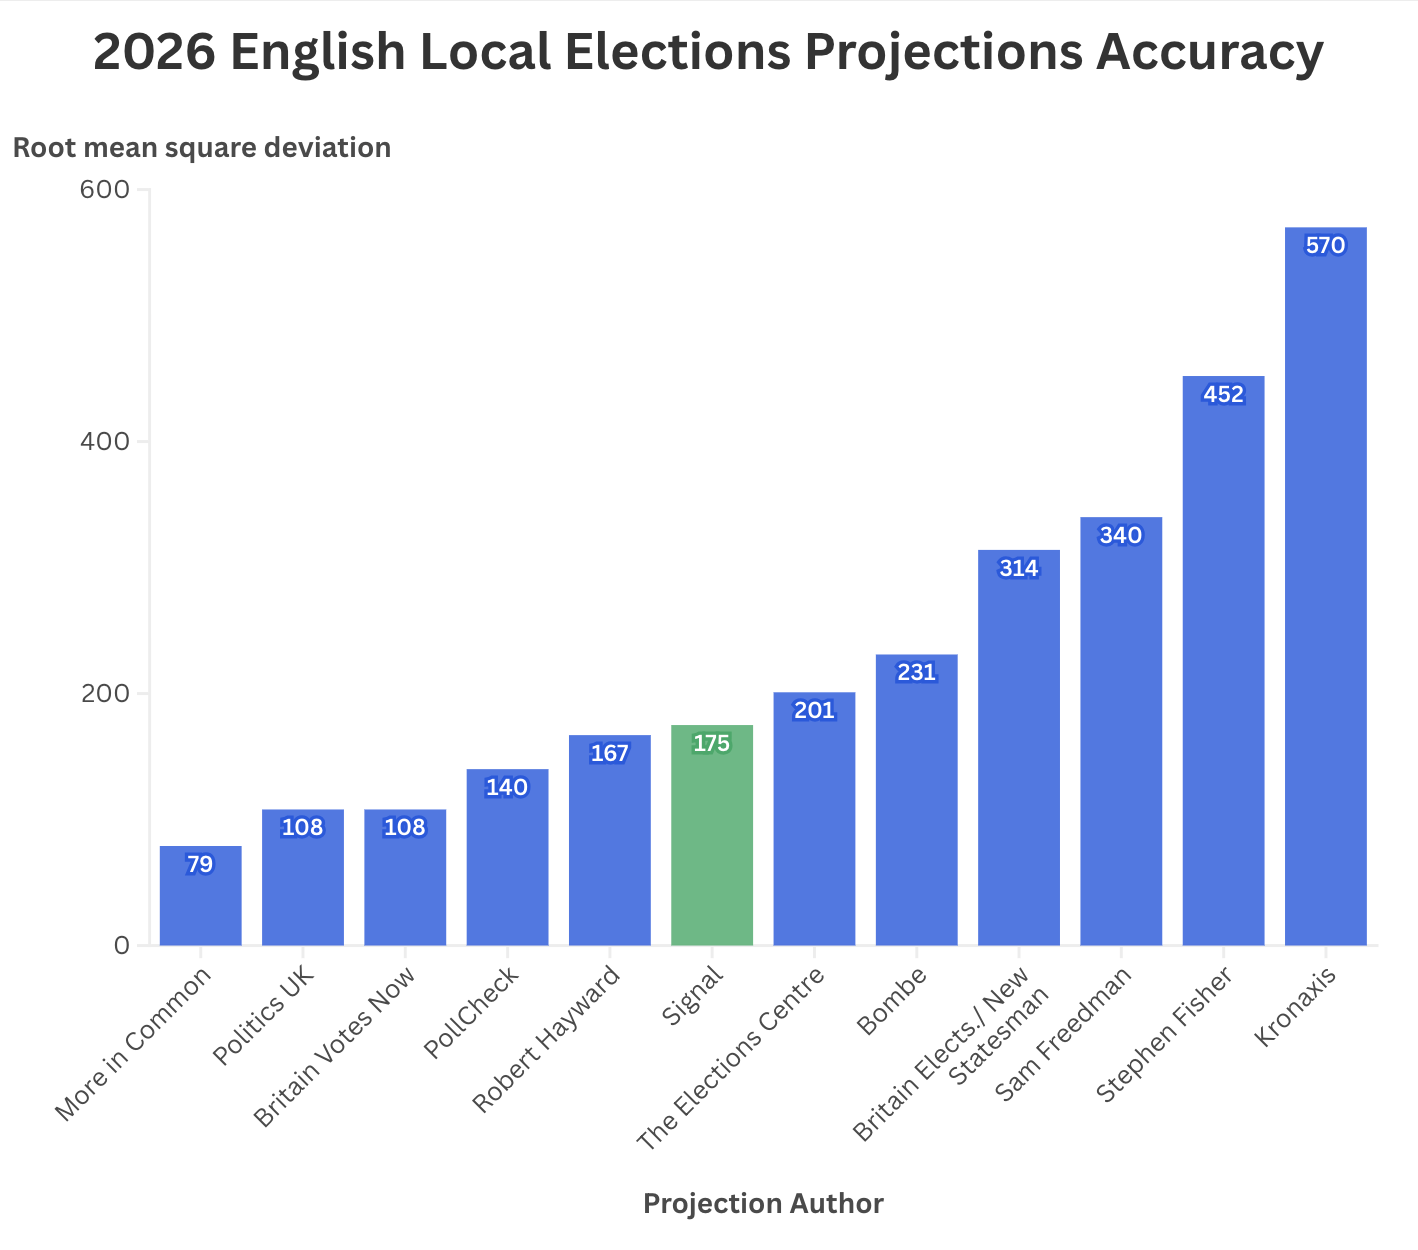
Of course, the projections were far from perfect. One recurring error was an overestimation of Conservative support outside of cities and affluent areas in the southeast. There were 40 wards that Signal projected as Conservative wins that actually voted for Reform. Calderdale in West Yorkshire is a particularly stark example of this phenomenon. Signal projected the Conservatives to have 11 councillors elected. In reality, they had none, with each of the four wards Signal had marked as Conservative victories instead being won by Reform UK. Signal had predicted Calderdale would elect 26 Reform UK councillors, one short of a majority. Had the model been less generous to the Conservatives in the district, it would likely have projected the Reform majority that materialised in reality.
Another common stumbling block was correctly forecasting independent support. In the absence of local polling data, the Signal model assumed that independents or local parties would retain 80% of their previous vote share. Unsurprisingly, that was not always an especially precise predictor of support for local candidates.
Nonetheless, taken as a whole, Signal’s projections were fairly accurate. Richmond upon Thames, where the Liberal Democrats secured a clean sweep of the council, was the only area that Signal predicted every ward spot on. But there were a further 20 council areas where it called more than 80% of the wards correctly. Furthermore, as highlighted, Signal’s projections do not look out of place amongst predictions made by pollsters and data scientists. So, while the model doesn’t yet rival Nate Silver’s, and there are certainly areas for improvement, as a whole, Signal’s projections for the 2026 elections should be treated as a success.
So, what’s next for Signal? There are plans to build out the sentiment maps feature and adapt the model for a General Election prediction. For now, the May election results are live on the Signal website, so please do take a look at how the projections compared with the results in individual council areas.

